Week 5 – Data: the grunt work of visual analytics
The practice of visual analytics and data visualization involves a lot more than making compelling visuals and graphics. Typically, it also involves hours of grunt work to get good data and then make it useable by whatever program you have in mind. Possibly the most pragmatic class of the course, Week 5 is about the challenges of Big Data and some pragmatic solutions.
What is Big Data
Big Data is commonly characterized by the 3 V’s: Volume, Variety, Velocity.
Challenges of Big Data
Big Data is messy and very informal
Echo Chamber effect
Volatility
Data curation process
Get some data
Clean it
Restructure it
Combine it
Explore it
Analyse and visualize it
Maintain it
Data cleaning and restructuring tools
Excel tools
Tableau Reshaper
Google Refine
Data Wrangler
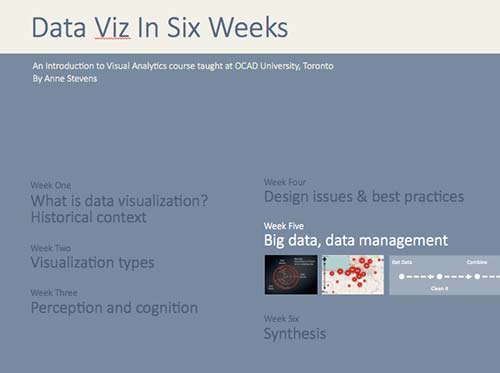
Here’s the slides, in the new and improved format.
DataViz in 6 Weeks is my blog about teaching Introduction to Visual Analytics at OCAD University in Toronto. Comments, follows and shares welcome. #DataVizInSixWeeks
Anne Stevens I am a multidisciplinary designer working in data visualization, interaction design, innovation and critical design. I am particularly interested in non-screen based physical representations of data and tangible user interfaces.