In visual analytics, data interaction can be as important data visualization. This tutorial is about adding interactivity to Tableau visualizations, specifically using Filters and Parameters. Filters Filters, you guessed it, let you filter data. In Tableau, they can be either static or interactive. An example of a static filter would be a condition that was set in worksheet mode to display a certain subset of the total data (eg. only.

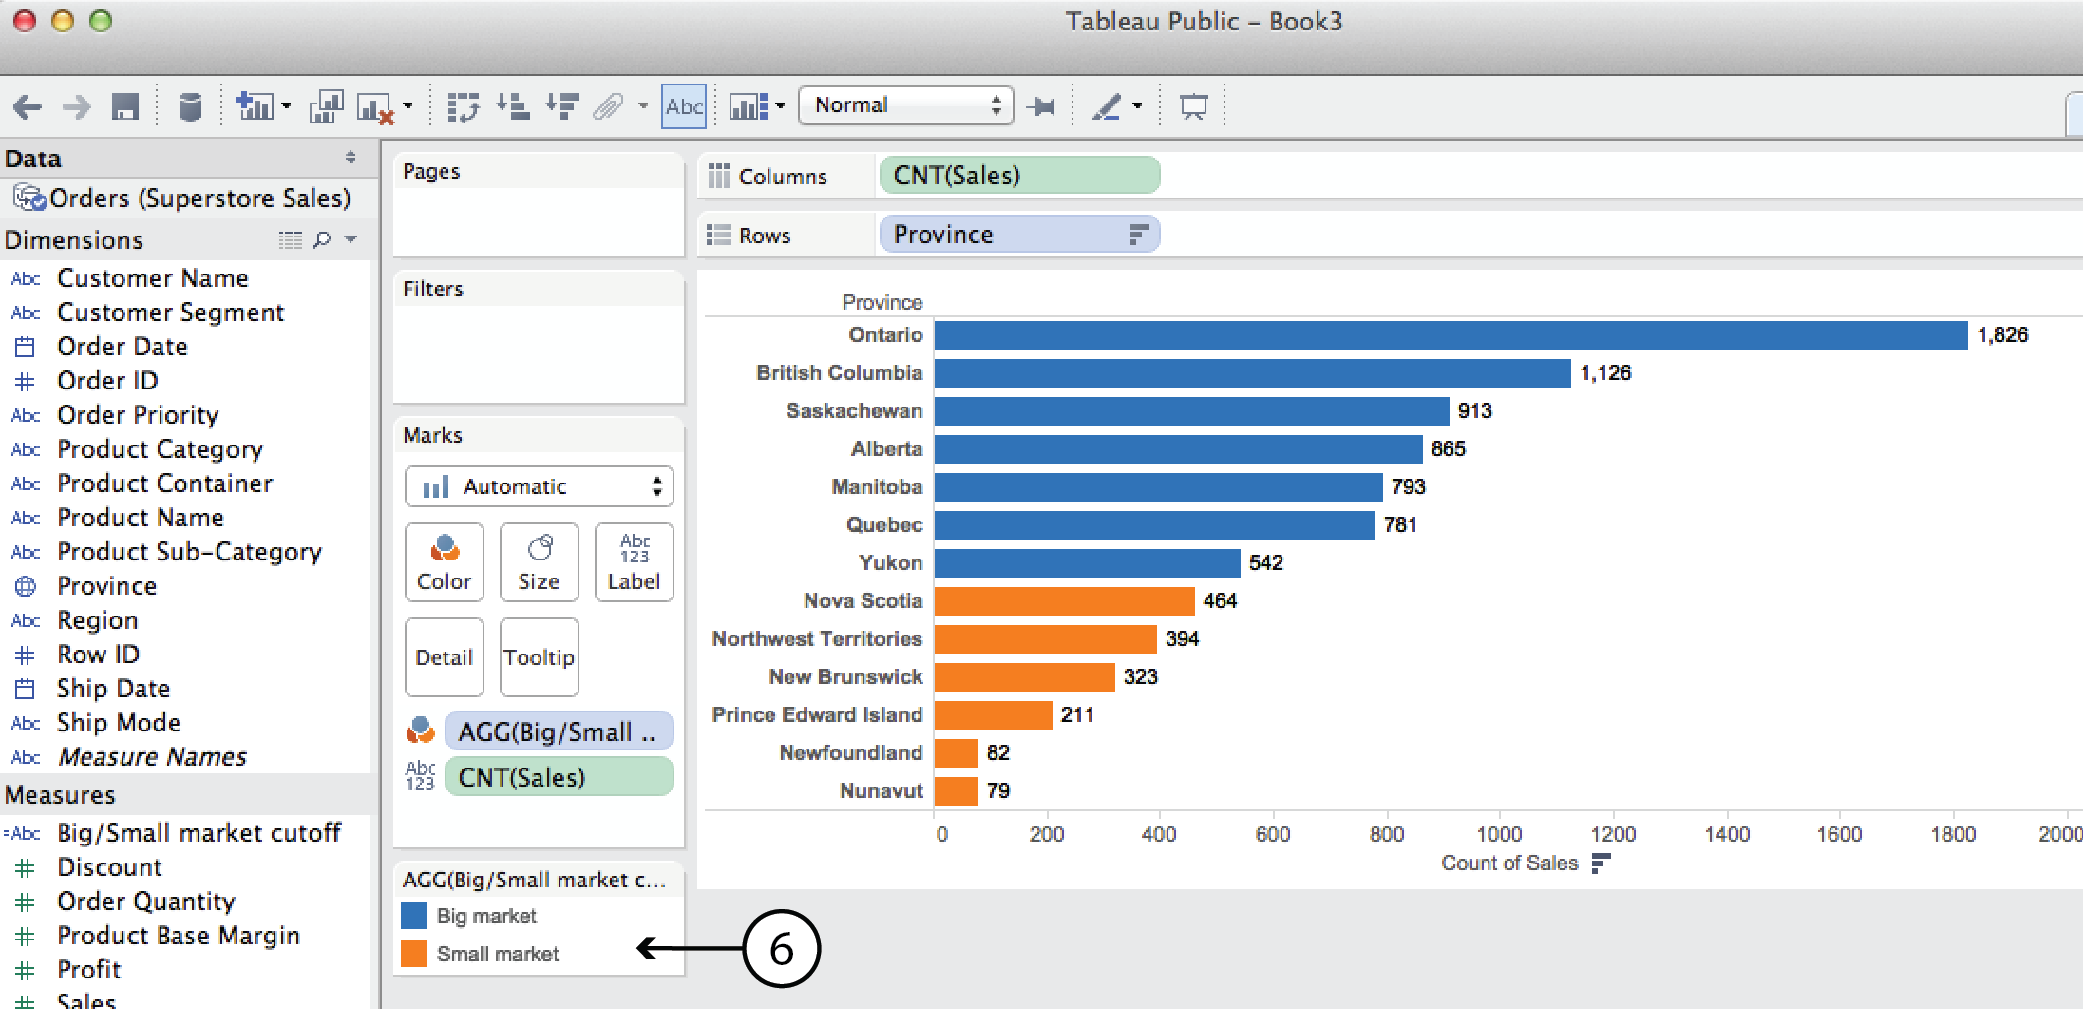
For many Tableau beginners, making high density, interactive visualizations can be a challenge. Tableau woes – Part 1 addressed this challenge with three strategies for combining data variables into a single display rather than plotting them in individual rows and columns (Tableau’s default mode, that makes direct comparison difficult to impossible): Measure Values Blending Axes Dual Axes This post will explain two more tools that can be used to add.
Naturally, Tableau Public’s Getting Started vidoes and tutorials make creating compelling visualizations look smooth and easy; as though you can simply download the program and hit the ground running. But from what I’ve seen in class (as well as my own experience), it ain’t necessaily so. Common frustration Once you connect to some data set and start placing Dimensions and Measures on Rows and Columns shelves, Tableau has a frustrating.