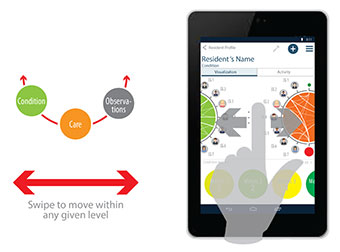
How can data visualization tools help caregivers better understand longitudinal health data and make infomed treatment decisions? How can networking tools improve collaboration and communication within the care network while protecting data privacy? This research project addresses these problems with a tablet-based prototype that can capture, structure, visualize, aggregate and analyse both formal and informal health data.

Two projects that demonstrate ways to upcycle so-called obsolete rotary dial telephones by combining them with other available technologies to make them function just like smartphones

The grand prize winning design for a national competition to design the greenest homes in Canada

A tabletop data visualization project that uses interactive data artefacts to both represent data and function as a tangible user interface

What happens when you track your movements for a month and then map the GPS data?
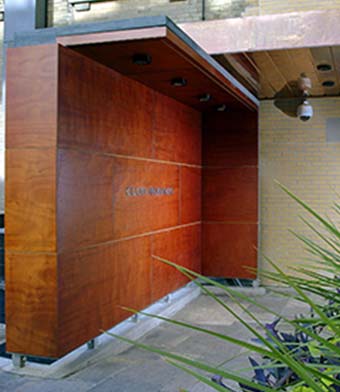
Commercial, institutional and residential architectural work of FORT architect inc.

An Information Visualization that uses the metaphors of human life expectancy and population growth to drive home data regarding the relatively short history of man made satellites in earth orbit.