DataViz around the campfire
Just launched version 2 of DataViz in 6 Weeks, a blog about teaching the Introduction to Visual Analytics course at OCAD University in Toronto.
First class, fall term, was disrupted by brand new classroom projector technology that worked until it didn’t, and a fire alarm evacuation that kept us huddled under an awning across the street to keep out of the rain. An hour later, we schlepped back up the stairs to the top floor. Computer restarted and, surprise, it still couldn’t connect to the projector. Kudos to the class for being good sports and gathering around my laptop for a small screen presentation about putting data visualization in context. In the half light classroom, it felt a bit like telling stories around a glowing camp fire.
- Historical Context: the emergence of statistical graphics in the 18th c, the ‘Golden Age’ in the 19th c, the dark ages and then a kind of renaissance and explosion in the 20th.
- Disciplinary Context: Not all visualizations are created equal. What, then, is the difference between infoViz, dataViz, visual analytics, data analytics and scientific/medical visualization? And what about non-screen based stuff like data sculpture and physical viz?
Thanks to Michael Friendly’s The Golden Age of Statistical Graphics for a great survey of the Golden Age of statistical graphics, and his Milestones of data viz website.
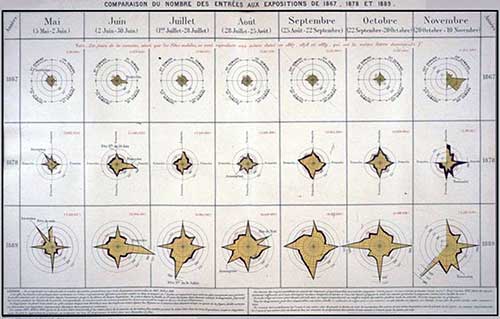
Two way star radial
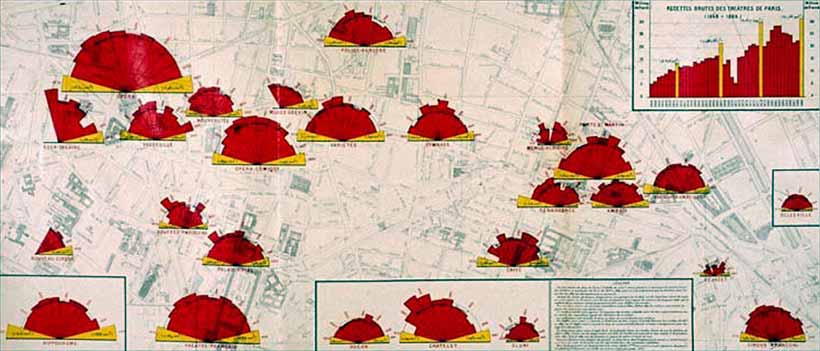
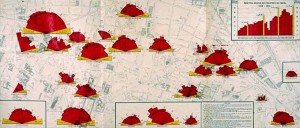
Polar radial viz of theatre audiences in Paris
Here’s the Week One slides.
DataViz in 6 Weeks is my blog about teaching Introduction to Visual Analytics at OCAD University in Toronto. Comments, follows and shares welcome. #DataVizInSixWeeks
Anne Stevens I am a multidisciplinary designer working in data visualization, interaction design, innovation and critical design. I am particularly interested in non-screen based physical representations of data and tangible user interfaces.