Deprecated: Function get_magic_quotes_gpc() is deprecated in /home/stevensa/public_html/wp-includes/formatting.php on line 1697
Deprecated: Function get_magic_quotes_gpc() is deprecated in /home/stevensa/public_html/wp-includes/formatting.php on line 1697
Notice: Array to string conversion in /home/stevensa/public_html/wp-includes/nav-menu.php on line 601
Notice: Array to string conversion in /home/stevensa/public_html/wp-includes/nav-menu.php on line 601
Notice: Indirect modification of overloaded property WP_Post::$Array has no effect in /home/stevensa/public_html/wp-includes/nav-menu.php on line 601
Warning: Illegal string offset 'output_key' in /home/stevensa/public_html/wp-includes/nav-menu.php on line 601
Notice: Array to string conversion in /home/stevensa/public_html/wp-includes/nav-menu.php on line 601
Notice: Array to string conversion in /home/stevensa/public_html/wp-includes/nav-menu.php on line 601
Notice: Indirect modification of overloaded property WP_Post::$Array has no effect in /home/stevensa/public_html/wp-includes/nav-menu.php on line 601
Warning: Illegal string offset 'output_key' in /home/stevensa/public_html/wp-includes/nav-menu.php on line 601
Warning: count(): Parameter must be an array or an object that implements Countable in /home/stevensa/public_html/wp-content/themes/themuse-parent/theme_config/theme_includes/THEME_FUNCTIONS.php on line 1681
Deprecated: Function get_magic_quotes_gpc() is deprecated in /home/stevensa/public_html/wp-includes/formatting.php on line 3466
The Care and Condition Monitor
Tablet based data visualization and networking tools for caregivers in long-term health care
In long term care, caregiver networks can be diverse and extended, including various medical professionals, service providers and friends and family. How can data visualization tools help caregivers better understand longitudinal health data and make informed treatment decisions? How can networking tools improve collaboration and communication within the care network?
CCM addresses these problems with a tablet-based prototype that captures, structures, visualizes, aggregates and analyses both formal and informal health data. Formal data includes test results, medication levels etc.; informal data includes more qualitative and subjective information such as a caregiver’s opinion of a resident’s progress towards a particular care goal. CCM also visualizes caregiver networks and fosters collaboration and sharing within them. Tablet based and small enough to fit in a smock pocket, it suits the ambulatory and hands-on nature of healthcare and supports on-the-fly and multi-modal data collection, touch screen interaction, rich visual output and networked communication.
__
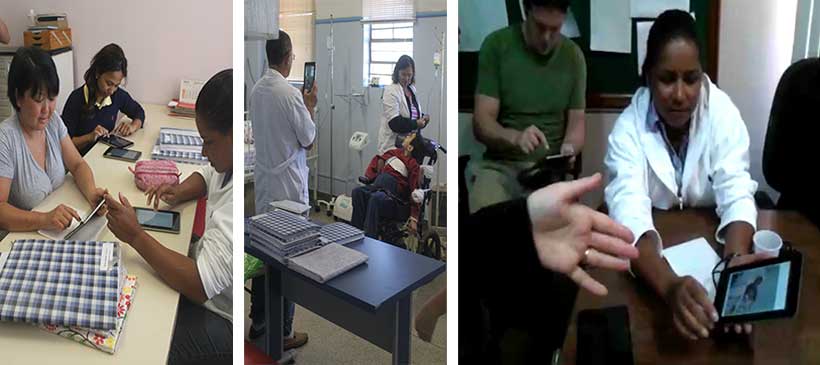
Field research
Ethnographic research helped us understand the unique needs and circumstances of the Clemente Ferreira CAIS long-term care hospital in Lins, Brazil, as well as its pain points:
- • In long term care, patient change can be slow and non-linear. Caregivers can easily lose sight of change, patterns and trends.
- • A strong tradition of oral communications amongst caregivers, especially to share informal information not captured in the medical records.
- • Established paper based healthcare records compete with emerging mobile phone practices.
- • Caregiver concerns re. privacy and surveillance associated with the introduction of new technologies.
Scenario development
The first prototype, Metas da Marta (Marta’s Goals), was designed around a hypothetical resident named Marta (a child with a number of developmental disabilities) and her team of caregivers. Marta’s principal caregiver has decided that it is time for her to learn to tie her shoes. Marta’s various caregivers (physio therapist, occupational therapist, social worker, teacher and nurses) then propose ways they can each contribute to that goal based on their own skills, specializations and treatments. For example, the physiotherapist proposes flexibility treatments and balance exercises; the teacher proposes a story book, the nurse offers practice sessions and encouragement. Each one uses the tablet based tool to join in and record their treatments and observations related to the goal using the all its various affordances (downloads, camera, video, voice recording, text, sketch).
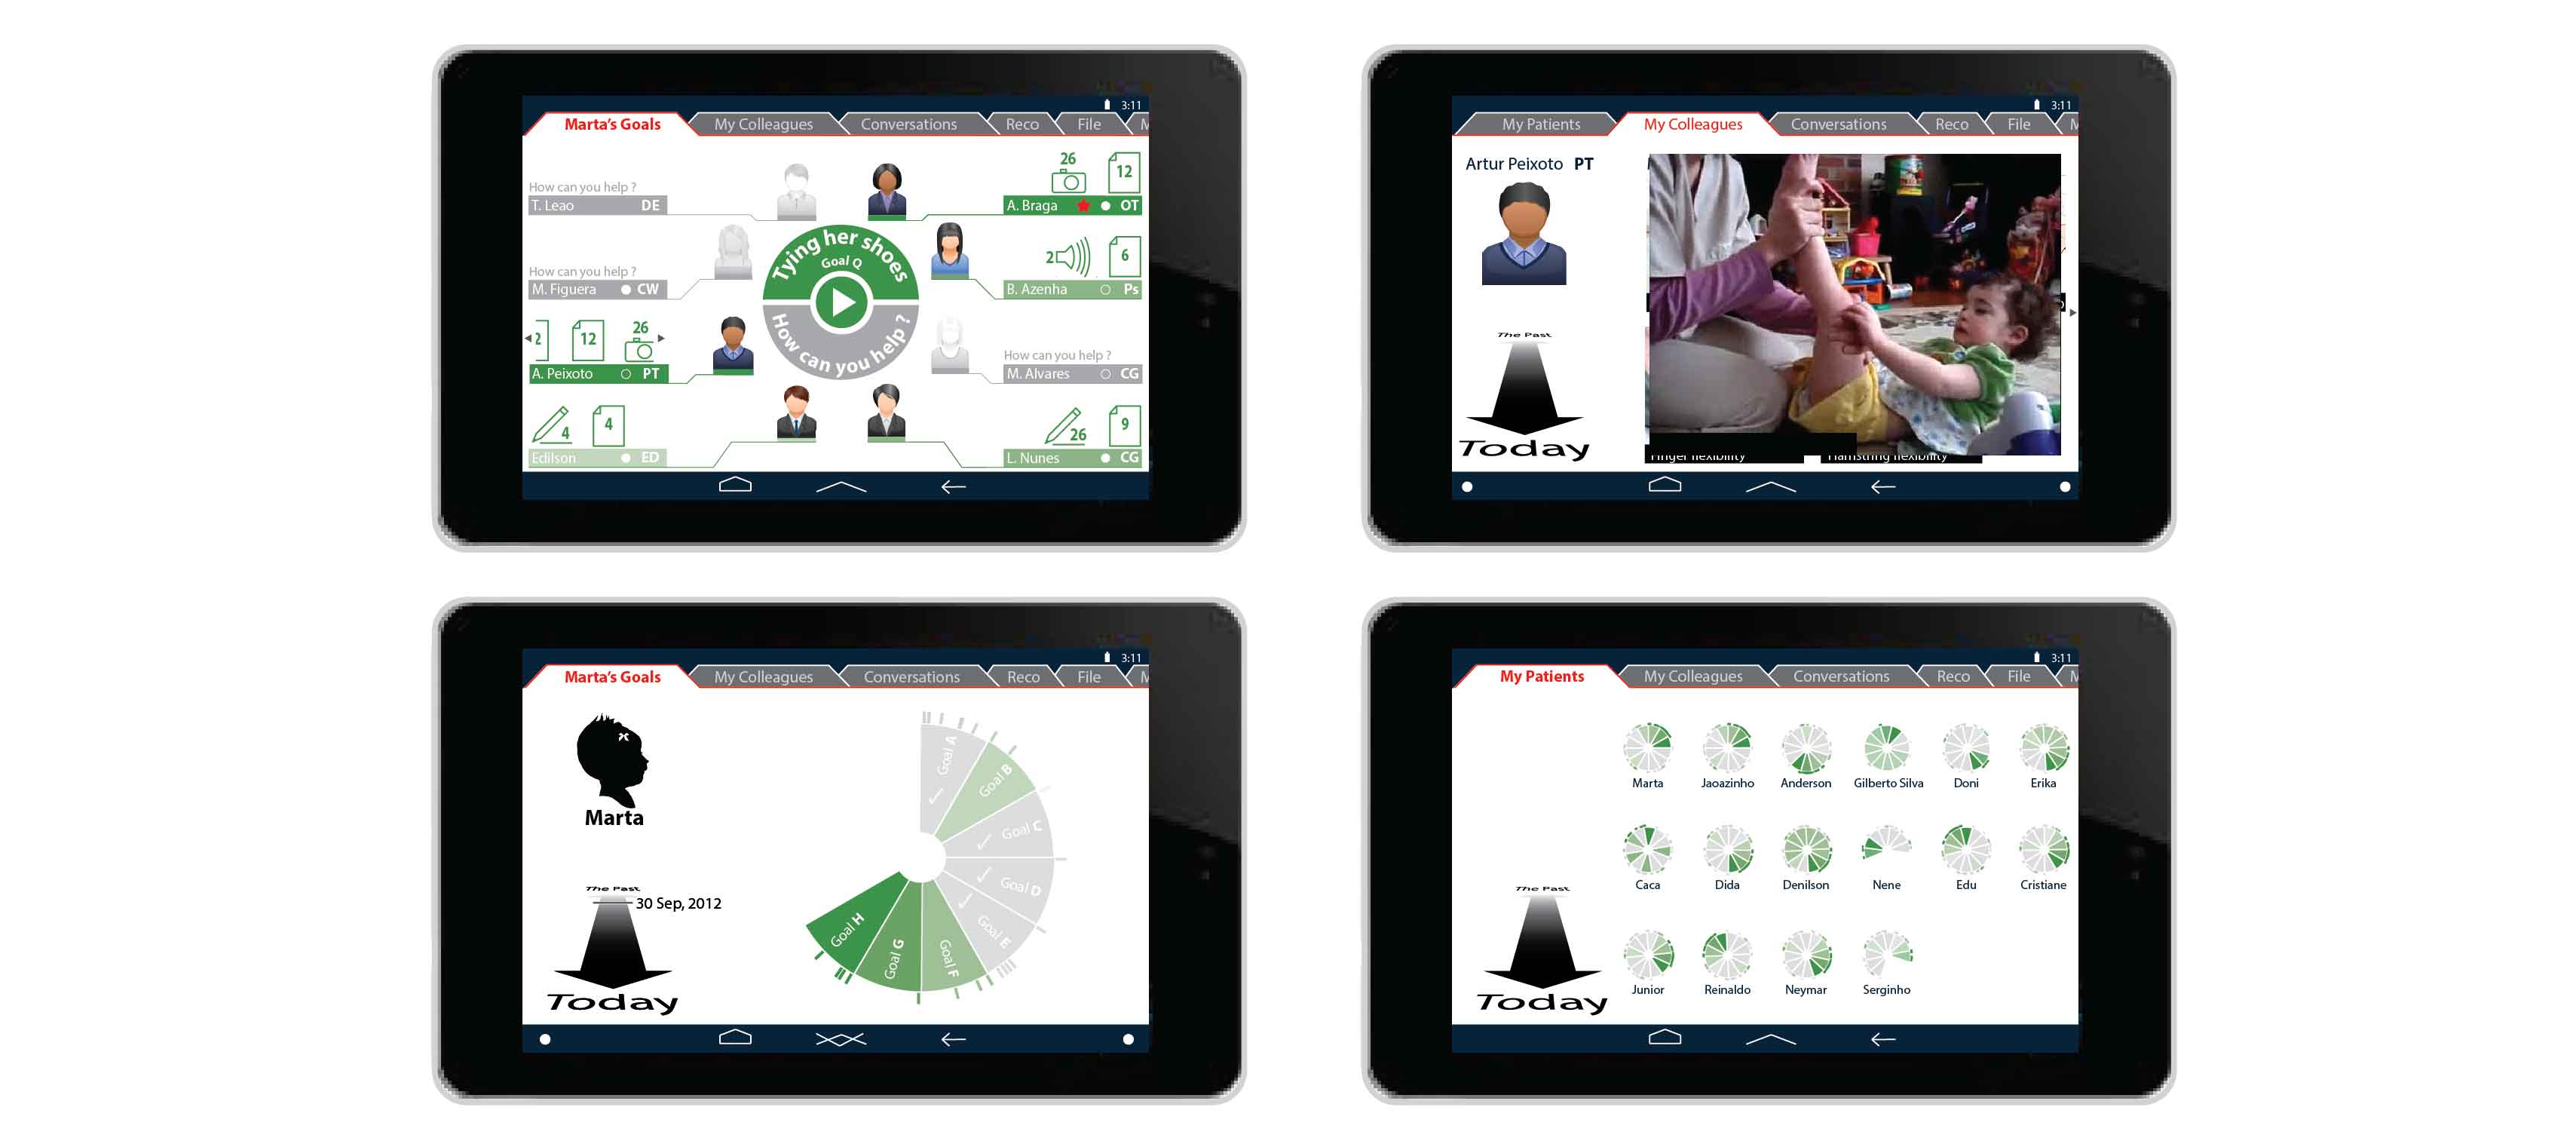
The tablet based tool was designed to foster collaboration around goals tailored to individual hospital residents, to establish benchmarks for measuring progress, and to aggregate data from a network of caregivers regarding that progress.
Participatory design workshops
Three days of hands-on workshops with hospital caregivers provided feedback regarding this prototype, as well as two others. It also generated caregiver excitement and buy-in. The following caregiver priorities were highlighted:
- • better understanding of change over time
- • making individualized care decisions informed by real data
- • capturing informal patient data
- • not replacing either the existing oral communications or paper records, so much as augmenting both
Refined design strategy
Workshop outcomes led to a number of strategic design decisions that went into the next prototype version. For example, a resident’s well being is described by two complementary categories of information: condition and care. Specialists establish individualized care goals, which are administered by teams of therapists, specialists, nurses and other caregivers. These treatments, in turn, impact a resident’s condition, which inform new care goals and objectives, and so it goes in a circular relationship.
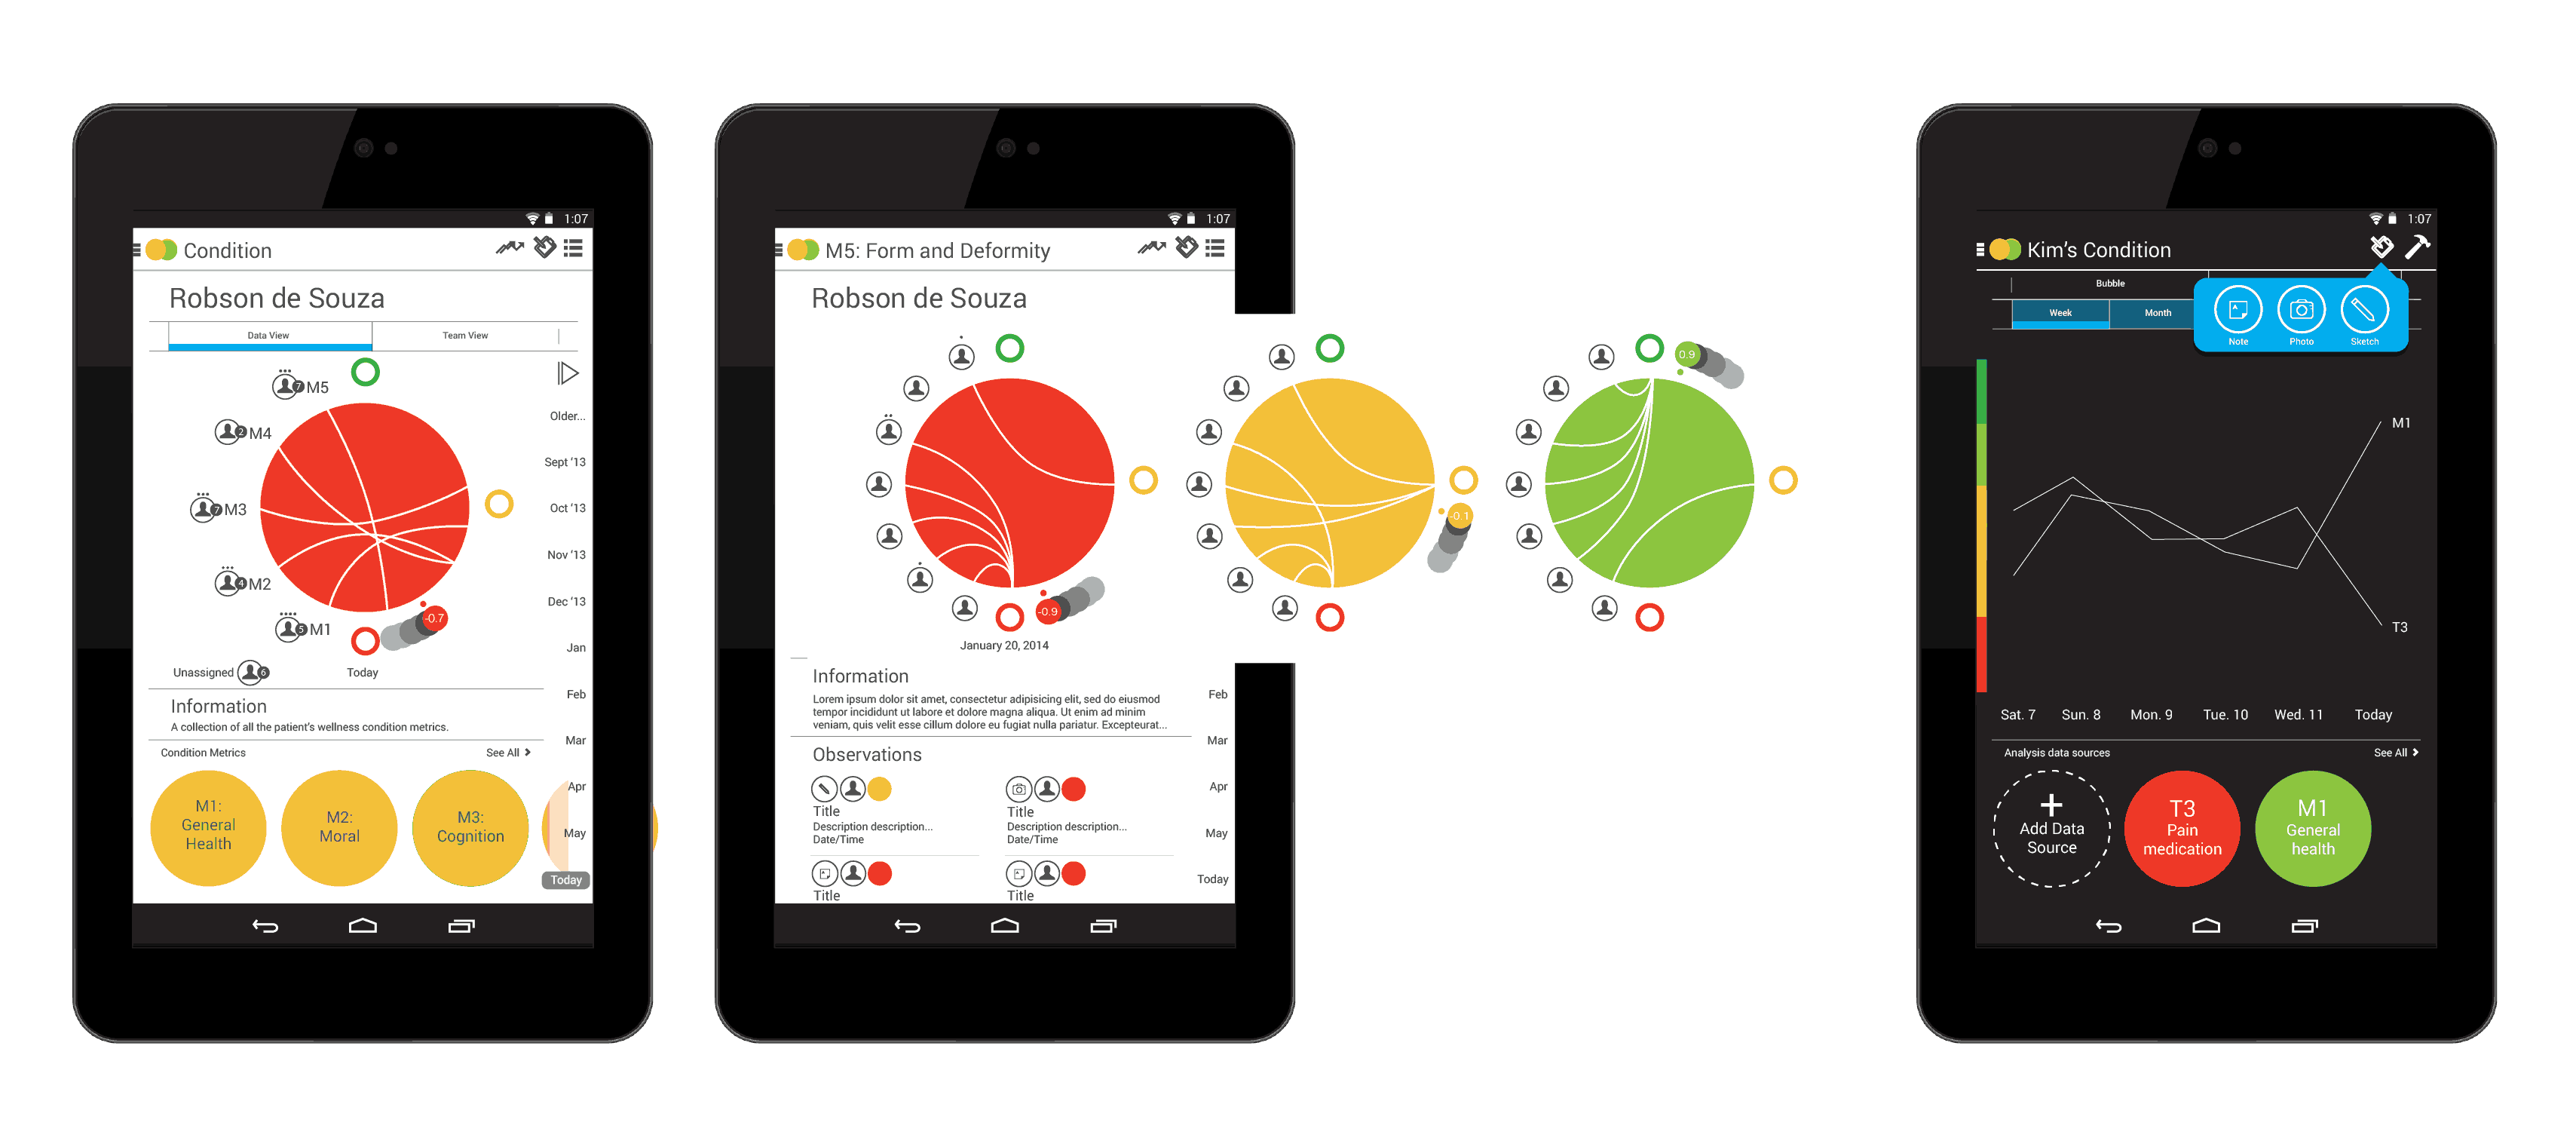
A peer voting strategy uses a straightforward red/yellow/green system, with red connoting decline; yellow stability; and green improvement. The simple system was designed to avoid caregiver input fatigue.
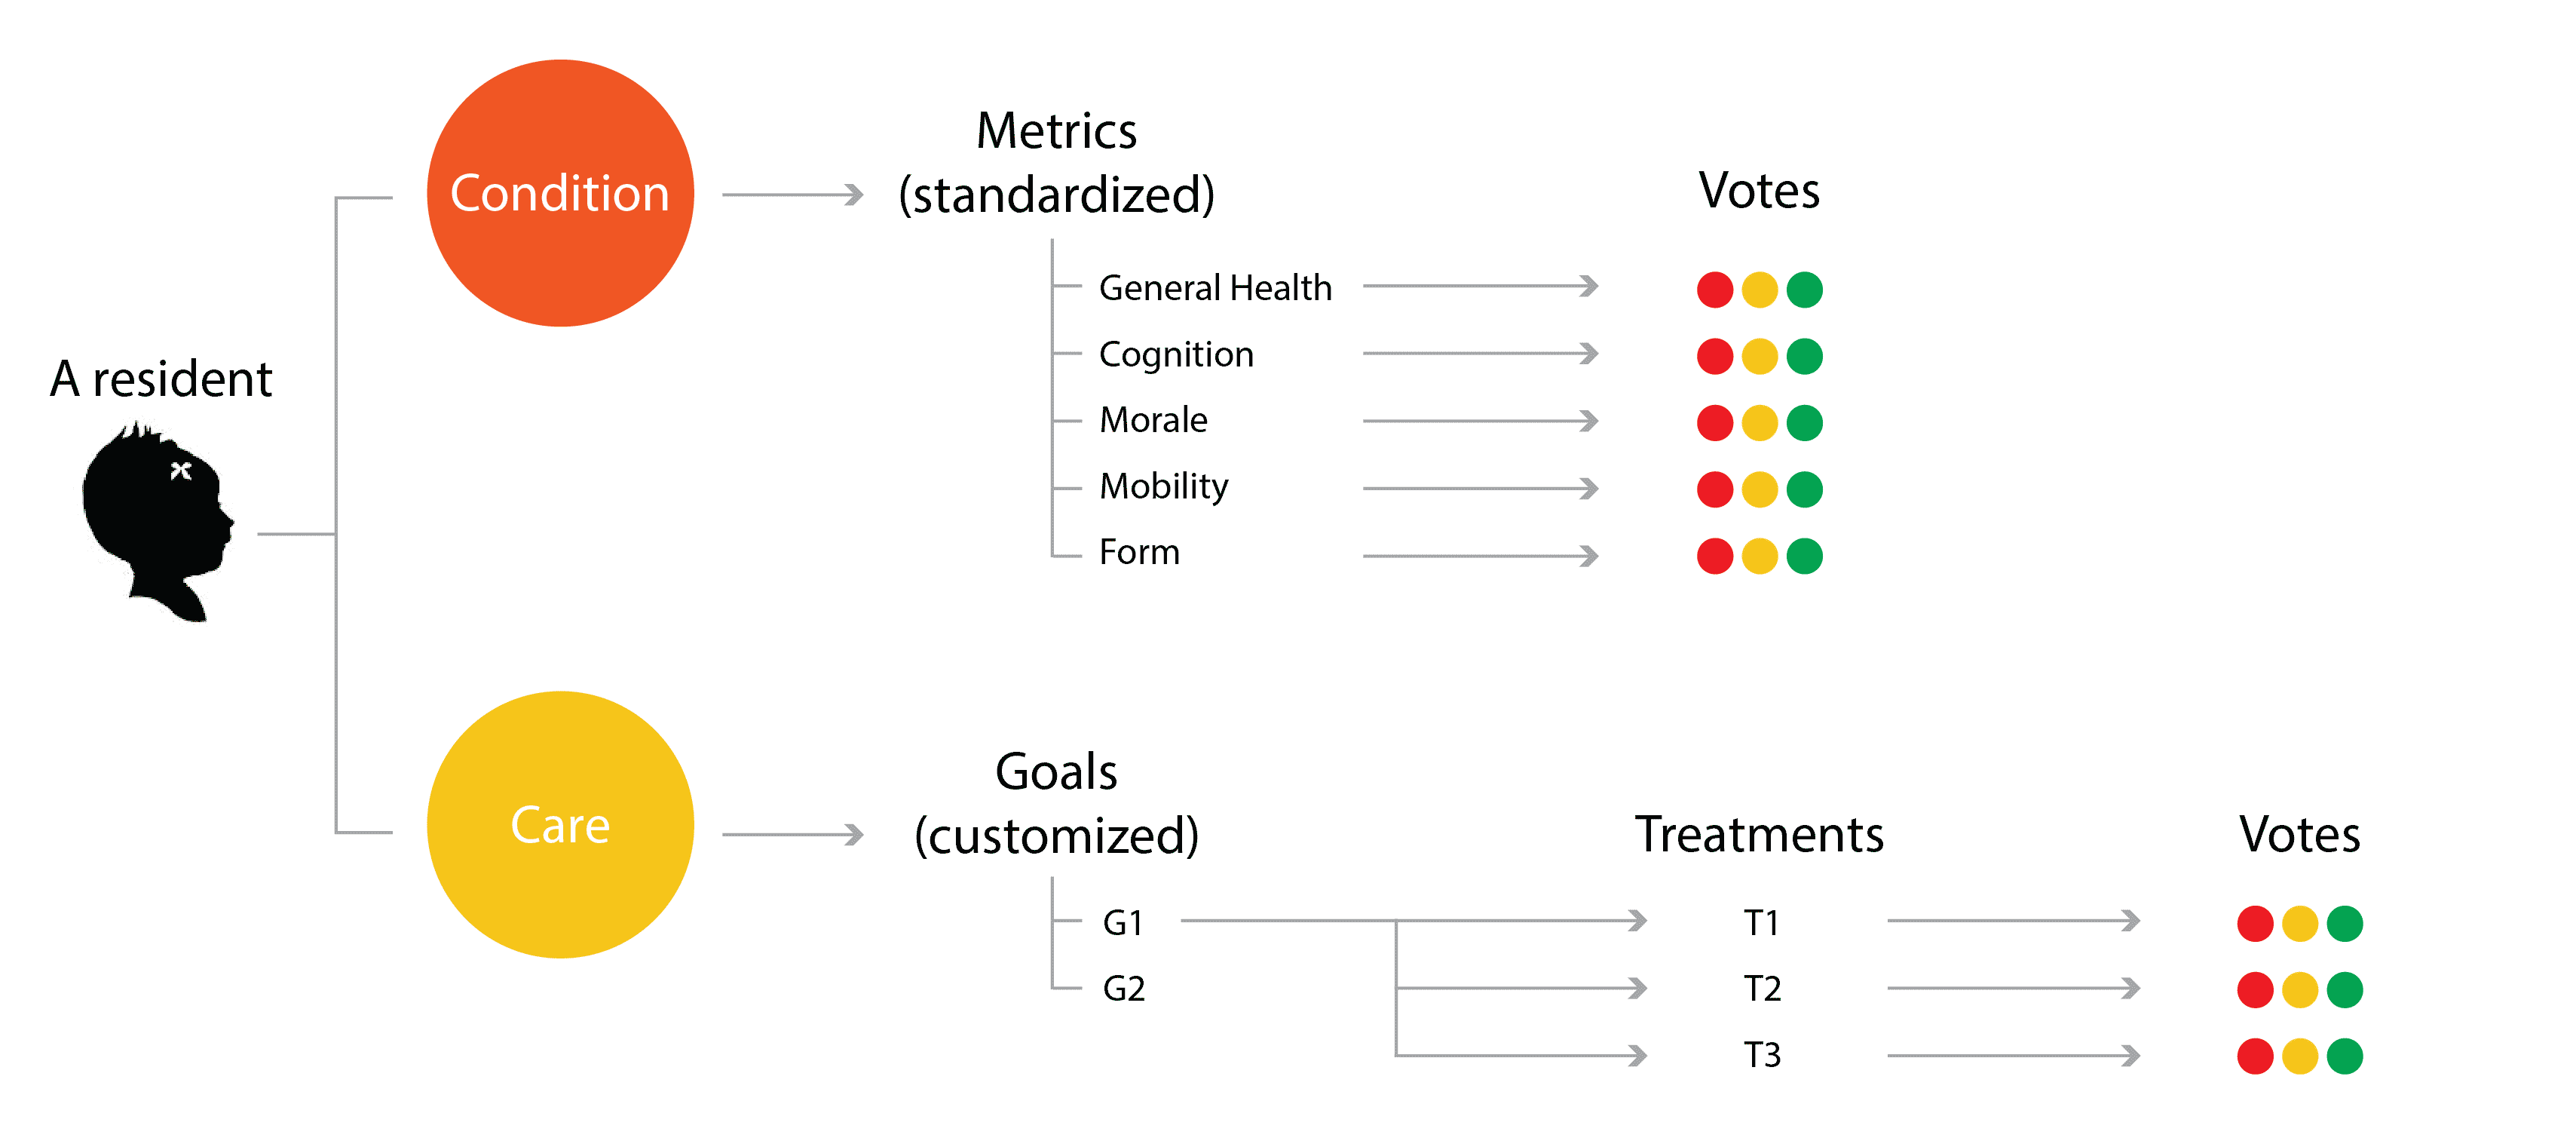
Colour averaging is used to then aggregate and average the votes along the red/yellow/green spectrum.

Navigation and architecture
The original navigation diagram reflected the condition -> metric -> vote and care goal -> treatment -> vote hierarchies of the overall design strategy combined with some additional app functionality, but was incomplete.
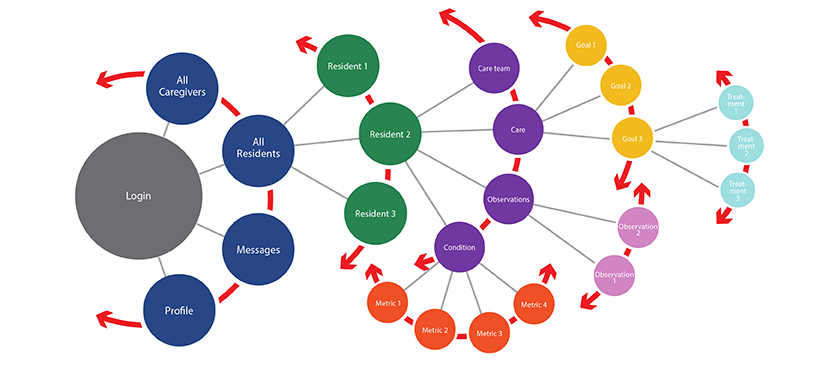
The final user flow diagram looked like this:

Design of visualization and analysis tools
The principal visualization consists of a large coloured circle, for overview. Additional detail regarding individual caregivers, their votes and observations is provided by the icons around the perimeter and the arcs joining them across the circle.
A smaller dot positioned around the perimeter of the large circle reinforces the colour of the large circle through its position on the red/green colour spectrum. It helps to make the visualization accessible to people with colour blindness. Additionally, its tail provides information about context, trend, data distribution and volatility.
User testing
User testing was conducted with low fidelity prototypes. Outcomes were incorporated into subsequent design generations.
Collaboration with back end development
While the UI and UX were being designed, back-end development was also taking place, including: structuring the database, developing the middleware and creating the algorithms necessary for the data analysis.
___
The project has been presented at, and published in, a number of peer-reviewed publications and conferences, most recently IEEEvis-2014.
Deprecated: Function get_magic_quotes_gpc() is deprecated in /home/stevensa/public_html/wp-includes/formatting.php on line 3466
Deprecated: Function get_magic_quotes_gpc() is deprecated in /home/stevensa/public_html/wp-includes/formatting.php on line 3466